Solargis Integrations
Monitor the reliability and consistency of your PV performance assessments
Solargis Monitor API helps you accurately assess solar project performance in near real-time.
Using third-party satellite-derived irradiation data promotes transparency and independent validation of performance reporting.
Data is available at 5/10/15-minute intervals, and aggregated from hourly up to yearly intervals.

Ground measurements tend to be costly and often come with gaps and errors, lacking some of the most necessary parameters that affect plant performance.
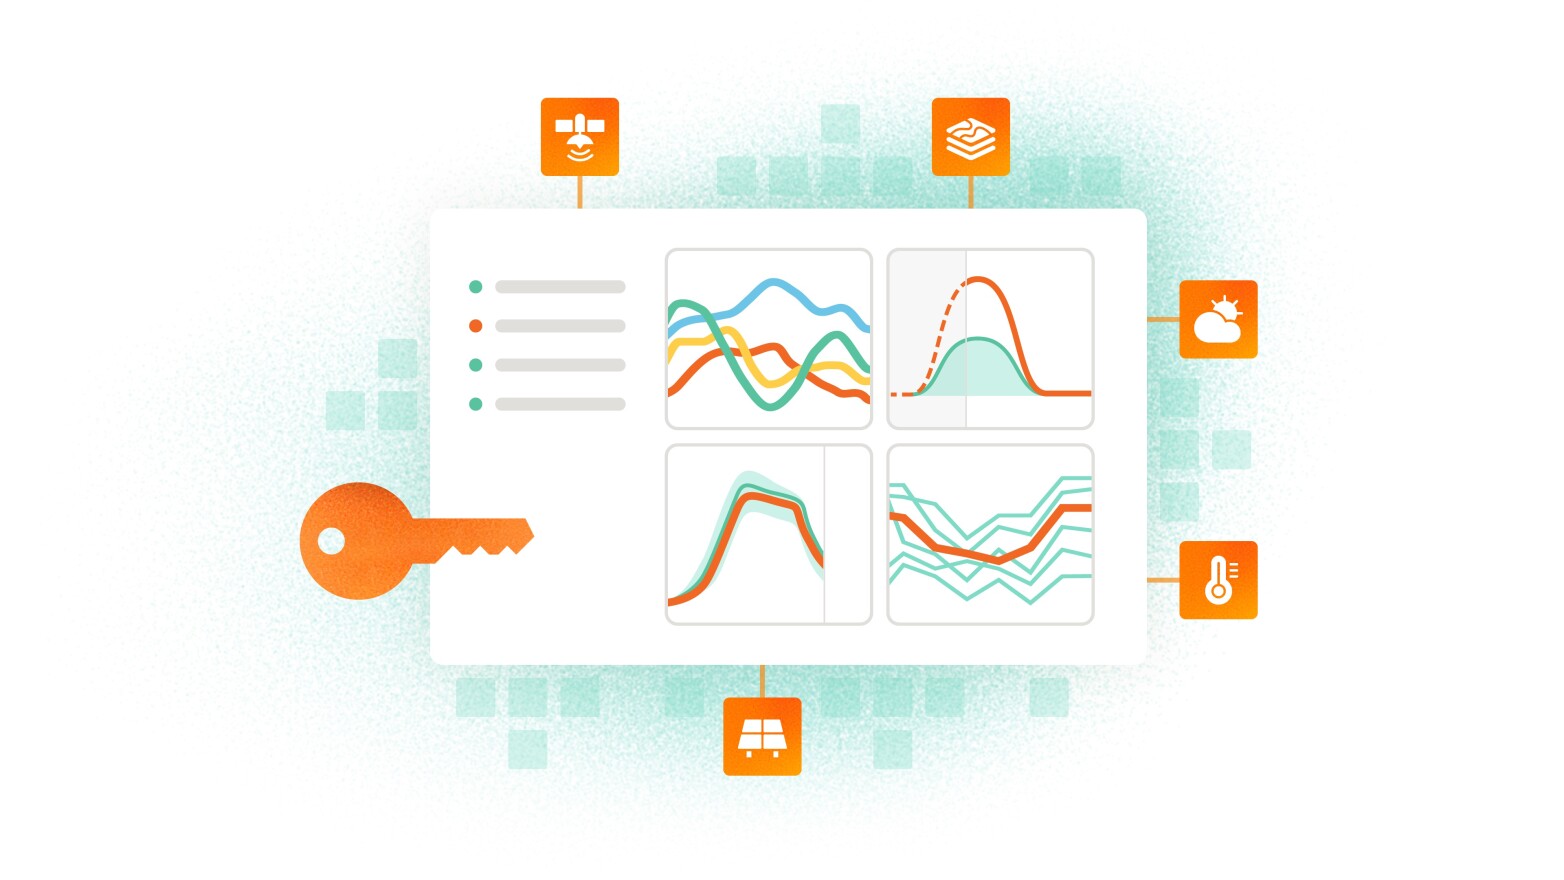
Solargis Monitor API gives you reliable satellite-derived data that is easy to access, accurate, and continuous. Operate with 20+ solar, meteo, and environmental parameters in near real-time and for any site around the globe.

Reliably calculate the site's performance ratio using site-specific solar radiation data.
Benchmark the real PV output against expected energy performance to assess the project's actual operational efficiency.
In doing so, you can be confident that your performance reporting to key stakeholders reflects the true environmental conditions and is both transparent and bulletproof.
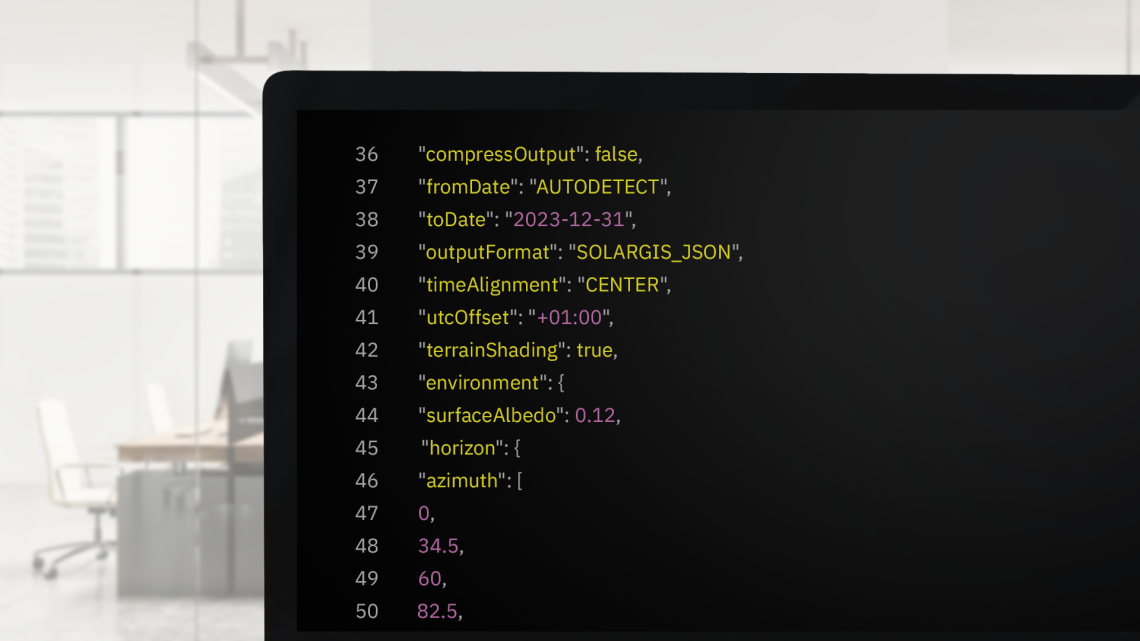
Connect any monitoring platform you are already using with reference data streams and automate the ingestion of key data inputs provided by Solargis Monitor API.
Our team has an open collaboration channel with the most popular software platforms available in the market so the integration of Solargis data is fast and easy.
Refer to the technical documentation to learn more.
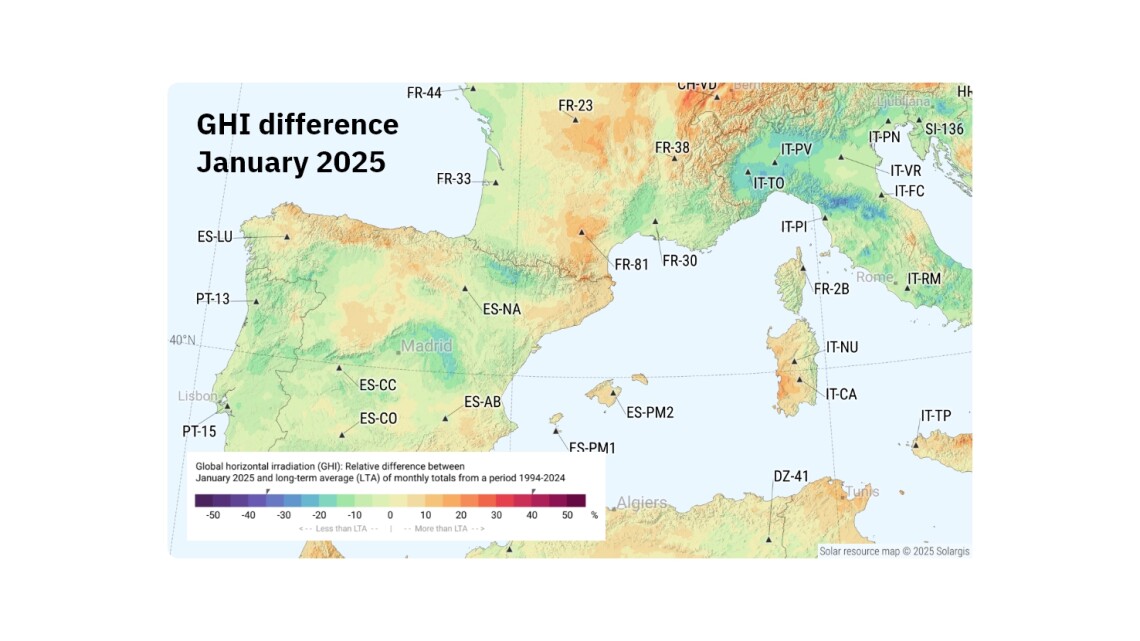
Receive vital solar and meteorological events for performance impact in detailed monthly PDFs that contain data and maps. Spot long-term trends by comparing monthly and yearly summaries against long-term averages to easily understand recent changes in the climate.
This additional service serves as a reliable mechanism to attribute production changes to solar irradiation and weather events.
Projects supported by our bankable solar & meteo data, software, and services every year
Years of experience with solar projects and improving industry standards
Coverage of the world’s population with 30 years of solar and meteorological data
Data-driven insights from our PV Performance Assessment report conducted after months or years of the plant's operation will help you optimize its performance.
The report also provides a revised and more accurate long-term energy yield estimate for refinancing or new asset acquisition purposes.
The PV Variability & Storage Optimization Study delivers statistical data and insights to project developers needed for designing and managing PV-plus-storage systems.
The study provides the most realistic data on PV power generation for grid integration analysis.


